Reconcile
Identify the required revenue, cost, fee and return data with their sources and missing fields.
◎ OBSERVATORY / 03 · INTELLIGENCE / MARGIN
PRODUCT STUDY / 03 · PROFIT INTELLIGENCE
Revenue is visible. Contribution is harder.
A proposed SKU-level profitability audit for Amazon and marketplace sellers who need to know what genuinely drives their margins.
An explanatory model for a prospective product, not a live profitability audit.
Account for fees, discounts and deductions
Unit cost, fulfilment and returns
Show assumptions and uncertainty, not false precision
Identify SKUs that require human verification
Concept only. No real marketplace accounts were audited or customer gains demonstrated.
01 / THE PROBLEM
Sales reports tell a seller what moves. Profit requires a more complete picture: platform fees, ads, shipping, returns and the product’s actual cost. Without consistent allocation, the best-selling SKU may not be the best business.
An ordinary margin calculator answers one product at a time. A useful product audits the entire SKU portfolio and highlights which economics deserve investigation.
Design principles for this product, not a claim that every feature below is already operational.
Identify the required revenue, cost, fee and return data with their sources and missing fields.
Define contribution-margin rules and cost allocation, with every assumption explicit.
Surface SKU groups with unusually weak contribution and attach the evidence behind each flag.
Select a situation to see how I would turn a business signal into a responsible next step. This is an interactive explanation, not a live product demo or completed diagnostic.
A SKU has increasing GMV alongside higher fees or ad spend.
Compare attributable cost movement and contribution before interpreting growth.
A revenue increase is not proof of improved profitability.
Commercial problem, target customer, proposed portfolio audit and visual direction have been defined.
Validate fee and COGS data availability, marketplace export formats, seller needs and cost allocation rules before building.
Current image is a concept reference. A verified walkthrough, recording or external product demo can be added later without rewriting this page.
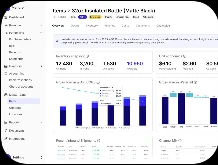
The dashboard is an illustrative concept. No marketplace integration or verified profit diagnosis is currently available.
Concept interface shown. Video walkthrough and demo URL have not been published.
More problems.
Better decisions.